注意:本指标源码用于同花顺。


指标源码


01
RR8:=MA(CLOSE,27);
RR9:=(CLOSE-RR8)/RR8*100;
RRA:=MA(RR9,2);
RRB:=BARSLAST(CROSS(-10,RRA)=1);
RRD:=RRA<-10 AND RRB>3;
STICKLINE(IF(RRD,-120,0),-120,0,8,0),COLORLIBLUE;
IF(RRD,-120,0),COLORYELLOW,LINETHICK2;
TYP := (HIGH + LOW + CLOSE)/3;
CCI14:(TYP-MA(TYP,14))/(0.015*AVEDEV(TYP,14)),COLORMAGENTA,LINETHICK2;

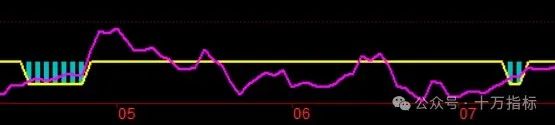
图片示例
风险提示:本指标公式仅作为知识分享,供交流学习使用,不构成任何投资建议,不作为投资依据。